· For the past 15 years we have lived through a time with very low volatility and high returns for stocks, with one or two outliers. I believe these two features are about to end abruptly for the most popular asset classes.
· I have 10% of my portfolio evenly distributed on these options.
· All these short ideas come from the research of Grizzly Research. All credit to them. As Pablo Picasso said, “Good artists copy, great artists steal.”. I have no problem acknowledging that shorting stocks is not my strength, but it is the strength of Grizzly.
· I have run a massive data analysis test on the track record of Grizzly Research. I will share a portion of my results here. If I were to release it all, I would have to write 100+ pages. And that would be a tough read. It is already 30 pages long though.
· Needless to say, I have asked Grizzly Research for permission to write this post. Everyone should follow them on X: @ResearchGrizzly and @SGEggert. For their full reports please visit grizzlyreports.com.
VIX: The return of volatility
The VIX is like a number that shows how much the stock market might wiggle in the next 30 days. It’s made by looking at special prices of options, which are like bets on the S&P 500 stock index. We mix those prices with some math to guess how shaky the market might be. A high VIX means people think the market will bounce a lot.
What exactly is the volatility index? (Difficult)
The VIX, or CBOE Volatility Index, measures the market's expectation of 30-day forward-looking volatility derived from S&P 500 index options. Here's a concise breakdown of its calculation:
Option Selection: The VIX uses a wide range of out-of-the-money (OTM) call and put options on the S&P 500 with more than 23 days but less than 37 days to expiration. This typically involves two expiration cycles to approximate a 30-day period.
Implied Volatility: The calculation focuses on the implied volatility of these options, which reflects the market's consensus on future volatility. Only options with non-zero bid prices are considered to ensure liquidity.
Variance Calculation:
The VIX is based on a model-free variance swap methodology. It calculates the expected variance by averaging the prices of OTM puts and calls, weighted by their strike prices.
The formula uses the following generalized expression for variance:
Formula for variance. Image generated using Grok.
Interpolation: Since options don’t always expire exactly 30 days out, the VIX interpolates between the variances of two expiration periods (near-term and next-term) to estimate a constant 30-day volatility.
Scaling to VIX: The variance σ2\sigma^2is annualized, multiplied by 100, and the square root is taken to express the VIX as a percentage:
Formula for VIX. Image generated using Grok.
Final Output: The result is the VIX value, representing the expected annualized volatility of the S&P 500 over the next 30 days. For example, a VIX of 20 implies an expected annualized volatility of 20%, or roughly 1.25% monthly.
Key Notes:
The VIX is updated in real-time during market hours using current option prices.
It’s often called the "fear index" because it tends to spike during market uncertainty.
The calculation is complex but standardized by the CBOE, ensuring consistency.
Building a historical model for VIX. And my overall thesis
The CBOE Volatility Index (VIX) was first introduced in 1993, with historical data calculated retroactively to 1986 using S&P 100 options initially, then S&P 500 options. The methodology was updated in 2003 to its current form, but data exists from 1986 onward.
However, as a history reader this is nowhere near enough. So, I decided to build a VIX Proxy index going back to 1885. I used data from the Dow Jones Industrial Average.
I calculated the proxy VIX in the table (1885–2025) using a 30-day rolling volatility of daily returns, primarily based on the DJIA for 1885–1956 and the S&P 500 for 1957–2025, with a scaling factor to mimic the CBOE VIX. However, the calculations for earlier years (pre-1957) were estimated based on historical DJIA price swings and market events from MacroTrends.
Proxy VIX. Own research.
One could argue that Zero Day to Expiry (0DTE) options have substituted the use of the VIX to some extent. But I believe the VIX still offers a useful view on the market.
As you can see from the graph above, volatility has been relatively high since 1885. In fact, the average index number has been 20.3. What is remarkable about this is that between 2011 and 2024 that the VIX was over 20 was due to COVID, which was momentary. Therefore, if we take the perspective of a historian, volatility has been rather muted for over 10 years.
The way I like to approach this is: The tide has been high for quite some time. And when the tide is high even the incompetent sailor or diver can survive. But when the tide is low, that is when problems arise. Warren Buffett said it best: "You only find out who is swimming naked when the tide goes out.". And I believe the tide is about to go out. Therefore, shorting stocks that are likely zeros is the best strategy I can think of.
Stock market volatility has decreased in baseline conditions (average proxy VIX from ~15–20 in 1885–1920 to ~12–18 in 1980–2025), due to mature markets and policy interventions.
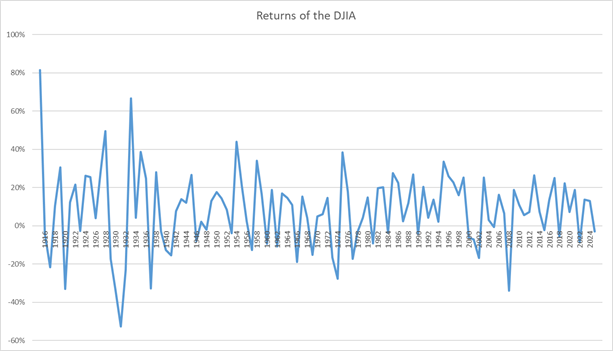
Returns of the DJIA. Macrotrends.
Stock market annual returns have improved significantly over time, from ~2–3% (1885–1920) to ~8–10% (1980–2025), driven by economic growth and market stability. I argue this increase has also been due to massive technological advancements and better demographics. However, as the curve from Moore's law is already flattening and demographics are worsening, the headwinds are strong.
Short ideas
Grizzly has put out reports that are dozens of pages long. In some cases, they are 90+ page long reports. Since I know that many of you don’t have the time to read them, I have read them for you and for each stock I will summarize the short thesis that Grizzly Research has. I will add my 2 cents too.
Important note for the reader: "My Take" sections reflect the current market caps as of May 17, 2025, while the summaries use the market caps from the dates of Grizzly Research’s reports, which span from 2020 to 2025. Therefore, you may find discrepancies in the market cap data.
Archer Aviation
Grizzly Research summary:
Overhyped Technology and Limited Commercial Viability:
The report argues that Archer’s eVTOL aircraft, particularly the Midnight model, face significant technical limitations. These include constrained range (projected at ~100 miles, insufficient for many urban air mobility (UAM) use cases), high battery costs, and long recharge times, which undermine operational efficiency.
Grizzly contends that the eVTOL market is oversaturated with competitors (e.g., Joby Aviation, Lilium), and Archer’s technology lacks a differentiated edge. The report cites engineering challenges, such as battery energy density and thermal management, as persistent barriers to scaling production and achieving cost-competitive operations.
Questionable Financial Projections:
Archer’s financial outlook is criticized as overly optimistic. The company’s projected revenue streams rely on speculative demand for UAM services, which Grizzly considers unrealistic given high per-trip costs (estimated at $3-$5 per passenger mile, comparable to or exceeding traditional helicopters).
The report highlights Archer’s high cash burn rate and limited liquidity. As of the report’s publication, Archer’s balance sheet showed significant capital expenditures on R&D and manufacturing facilities, with no near-term path to profitability. Grizzly estimates Archer may need substantial additional funding, potentially diluting shareholders.
Archer’s valuation (trading at a high enterprise value-to-revenue multiple compared to peers) is seen as unjustified given the lack of tangible revenue and unproven unit economics.
Weak Partnerships and Regulatory Hurdles:
Grizzly questions the strength of Archer’s key partnerships, such as with United Airlines and Stellantis. The United Airlines order for 200 aircraft is described as non-binding and contingent on regulatory approval, with no firm delivery timeline. Stellantis’s manufacturing support is viewed as insufficient to address Archer’s scaling challenges.
Regulatory risks are a major concern. The report notes that the FAA’s certification process for eVTOLs is rigorous, with uncertain timelines. Archer’s ability to meet Part 135 air carrier certification and Type Certification standards is questioned, potentially delaying commercialization beyond 2025.
Market and Competitive Risks:
The UAM market is characterized as nascent, with unproven consumer demand. Grizzly argues that Archer’s target market (high-income urban commuters) is too narrow to support its ambitious production goals (e.g., 2,000 aircraft annually by 2030).
Competition from better-funded or more advanced players (e.g., Joby Aviation, with stronger FAA progress, or traditional aerospace giants entering the space) could erode Archer’s market share. The report also notes potential cannibalization from autonomous drones and ground-based mobility solutions.
Corporate Governance and Insider Activity:
The report raises concerns about insider selling and executive turnover, interpreting these as signals of weak confidence in Archer’s long-term prospects. It also critiques Archer’s SPAC merger (via Atlas Crest Investment Corp.) as a mechanism to inflate valuation without delivering operational milestones.
Grizzly suggests that Archer’s leadership has overpromised on timelines (e.g., commercial launch by 2024) while downplaying technical and financial risks, potentially misleading investors.
Bearish Conclusion:
Grizzly concludes that Archer is a “lame duck” with a substantial risk of failure due to its combination of technical, financial, and regulatory challenges. The report predicts significant downside risk for ACHR’s stock price, potentially approaching zero if Archer fails to secure additional funding or meet certification milestones.
The short seller recommends investors avoid or short ACHR, citing a disconnect between its current market capitalization and intrinsic value based on discounted cash flow (DCF) analysis, which Grizzly estimates as negligible under conservative assumptions.
My take:
Since Grizzly’s August 2023 report, ACHR’s shares outstanding have increased 37%, diluting investors further. Q1 2025 financials (May 9, 2025) show zero revenue, with losses up 17.5% to $130 million. Net current assets are $600 million, down 10%, likely forcing more share issuance in 2025 as cash burn accelerates.
This will pose a problem for long term investors who have already seen their stake diluted. But it will also provoke a problem for Archer as the market liquidity is drying up, particularly for high risk opportunities like Archer.
Insider transactions at Archer. Finviz.
Furthermore, insider have been selling significant amounts of shares while there have been very few purchases in the past few months.
The company has achieved some partnerships and deals since the Grizzly report came out. However, they have not resulted in revenue. Plus, the company has more than doubled its research and development expenses in 2 years, but they have essentially nothing to show for it.
The eVTOL sector faces scepticism. Joby Aviation’s FAA certification delays, signal broader hurdles. Insider trades (Finviz.com) show 400,000 shares sold recently, with few buys, reflecting unease.
A May 15, 2025, announcement named ACHR the air taxi provider for the 2028 LA Olympics, but it’s non-revenue-generating and hinges on FAA approval. R&D expenses have surged 100% since 2023, yet Midnight’s range remains unproven. With market liquidity drying up for high-risk plays, ACHR’s $7.3 billion valuation looks like a grounded dream.
Celsius
Grizzly Research summary:
Celsius Holdings (NASDAQ: CELH), the zero-sugar energy drink maker, boasted a $2.14 billion market cap in 2020, with 2019 revenue of $75 million. But Grizzly Research’s October 2020 report, “Why We Don’t Trust Celsius Holdings Inc. Portrayed Growth,” alleges its growth is a mirage built on channel stuffing and shady governance.
Grizzly claims Celsius inflated European sales via its 2019 Func Foods acquisition, doubling revenues from $3.4M (Q3 2019) to $6.8M (Q4 2019). Adjusting for Func’s 21.2–59.7% margins show flat or negative growth, with rising payables hinting at channel stuffing. Func, nearly insolvent, was a questionable buy, likely used to fudge numbers.
Key shareholder Carl DeSantis, tied to Rexall Sundown’s pyramid scheme and FTC lawsuits, is flagged as the mastermind. Func’s ex-owner Andreas Celik links to the Paradise Papers, and investors Roger Ng and Tim Leissner are embroiled in the 1MDB scandal. Insiders, including DeSantis’s Arcus Capital, dumped 5.35M shares in 2020, signalling doubt.
Celsius’s “clinically proven” health claims, backed by self-funded studies, face scrutiny. A 2018 Rockstar lawsuit accused false “dietary supplement” labels.
Why Short? CELH’s valuation assumes unstoppable growth, but manipulated sales, legal battles, and insider exits spell trouble. A consumer shift or FTC probe could tank it.
My take:
Since Grizzly’s 2020 report, CELH’s shares outstanding have increased 12%, diluting investors to fund growth. Q1 2025 earnings (May 6, 2025) show revenue at $355.7 million, up 8% year-over-year, and net income at $77 million, up 18.6%. Cash reserves are $1,003 million, up 5%, but dilution risks remain.
The energy drink sector is saturated: Monster and Red Bull dominate with 60% U.S. market share. Health-conscious consumers are shifting to alternatives too.
Insider trades (Finviz.com) show 400,000 shares sold in the past three months, with no buys, echoing 2020’s Arcus dump. In 2023 the $82.6M Flo Rida case plus a 2022 class-action over “no preservatives” claims (despite citric acid) add legal risk.
The $1.8 billion Alani Nu buy risks integration woes. And it hasn’t stemmed U.S. retail decline, and legal costs rose 10% since 2023, with a new May 2025 lawsuit alleging deceptive marketing.
GeneDx Holdings
Grizzly Research summary:
GeneDx Holdings (NASDAQ: WGS), a genetic testing firm, saw its stock rocket 2,500% in 2024, but Grizzly Research’s February 2025 report, “Insiders Attest That GeneDx Is Actively Committing Widespread Fraud,” alleges it’s built on illegal billing.
Grizzly claims GeneDx inflates revenue ~25% via “code stacking,” an illegal practice banned since 2013, overbilling Medicaid/Medicare. Whistleblowers, including a former VP, implicate CEO Katherine Stueland and CFO Kevin Feeley. “Independent” counselling entities allegedly funnel patients to GeneDx, violating regulations. A 2022 UnitedHealthcare settlement ($42 million) hints at prior misconduct. With a $2 billion valuation, GeneDx faces claw backs and DOJ fines (peers paid $800M+). Insider selling and a failed Centrellis platform add to risks.
Why Short? Fraud exposure and regulatory fines could gut GeneDx’s cash, crashing its overblown valuation.
What to Watch: Q2 2025 earnings (August 2025) for litigation provisions and revenue sources. Monitor CMS guidelines and DOJ fraud probes.
My take:
Since Grizzly’s February 2025 report, WGS shares outstanding have increased 20%, diluting investors to fuel growth. Q1 2025 earnings (April 30, 2025) show revenue up 42% to $87.1 million, but a GAAP net loss of $7.4 million, driven by an EPS miss of -$0.23 against $0.06 expected, with cash reserves at $160.2 million, supporting growth amid ongoing dilution risks.
The genetic testing sector faces scrutiny: CMS tightened billing rules in April 2025, increasing WGS’s fraud risk. Insider trades (Finviz.com) reveal 500,000 shares sold by management (Stueland and Feeley) in the past three months, with zero buys, signalling unease.
Partnerships with Mount Sinai have weakened, and a new deal with LabCorp hasn’t offset billing concerns. R&D spending surged 30% since 2023, yet test accuracy lags competitors like Natera.
With DOJ probes intensifying, WGS’s $2 billion valuation looks ripe for a fraud-driven correction. In fact, my options are almost ITM as the stock has plummeted 30% in one month.
Innovative Industrial Properties
Grizzly Research summary:
Grizzly Research’s report accuses Innovative Industrial Properties, Inc. (IIPR), a cannabis-focused REIT, of operating a flawed business model resembling a “pyramid scheme,” marked by overvalued property acquisitions, insolvent tenants, and sham transactions to prop up financials. The report alleges IIPR inflates its portfolio’s book value through questionable deals, risking significant rental income losses, and compares it to WeWork’s unsustainable model, predicting a sharp stock decline.
Key Allegations:
Overvalued Property Acquisitions and Sham Transactions:
Grizzly claims IIPR pays massive markups for properties, often days after tenants buy them at lower prices, suggesting fraudulent overpayments to inflate book value. Examples:
Lansing, MI (Ascend Wellness): IIPR paid $4.8M in July 2019, days after the seller paid $930,000, a 5x markup.
Dwight, IL (PharmaCann): IIPR paid $18M in October 2019, vs. $1.75M a year earlier, a 10x markup with minimal improvements.
Harrison Township, MI (Emerald Growth): IIPR paid $6.9M in June 2019, vs. $2M a day earlier, a 345% markup.
These deals allegedly inject cash into financially strained tenants, masking their insolvency.
Insolvent Tenants and Risky Portfolio:
IIPR’s tenants, including PharmaCann (17% of 2020 rent) and Vireo (4%), are financially distressed or near insolvency, risking 38–49% of 2020 rental income.
PharmaCann: $101.8M in liabilities, $13.4M cash as of June 2019, and a failed MedMen acquisition. Grizzly alleges IIPR funds PharmaCann via overpriced sale-leasebacks (e.g., $3M annual rent for empty land in Scott Township, PA).
Vireo: 92% stock decline since 2017, low margins (16% vs. 35% expected), and high lease yields (13.5–16.5%) strain cash flow.
Other tenants (DionyMed, MJardin) are bankrupt or near insolvency.
Unsustainable Business Model and Dividend:
IIPR’s model relies on high-yield (~14%) sale-leasebacks with risky cannabis tenants, funded by capital raises ($832.65M since 2016). Grizzly likens this to a pyramid scheme, as dividends ($86M in 2020) exceed sustainable cash flows.
The report predicts dividend cuts or reliance on dilutive equity raises due to tenant defaults and overpaid assets.
Regulatory and Competitive Risks:
Federal cannabis legalization (e.g., SAFE Banking Act) could open banking access, reducing tenant reliance on IIPR’s high-yield leases.
COVID-19 disruptions (e.g., dispensary closures, construction delays) exacerbate tenant risks.
Leadership Concerns:
Executive Chairman Alan Gold’s new venture (IQHQ, $770M raised) suggests divided attention, similar to WeWork’s Adam Neumann. Gold’s $2.6M salary is questioned given IIPR’s growth-stage needs.
Supporting Evidence:
Field Research: Grizzly visited properties (e.g., Scott Township, PA; Dwight, IL), finding minimal improvements or empty land despite high rents. Photos and county clerk interviews question property valuations.
Deed Records: Documented markups (e.g., Lansing, MI: $930,000 to $4.8M in days; Harrison Township: $2M to $6.9M in a day).
Financial Analysis: Tenant financials (e.g., PharmaCann’s $101.8M liabilities) and IIPR’s rental income projections (38–49% at risk) highlight insolvency risks.
SEC Filings: IIPR’s tenant improvement commitments ($195M) and cancelled funding (e.g., $4M by PharmaCann) signal distress.
Conclusion and Price Target: Grizzly concludes IIPR’s portfolio is toxic, with overvalued assets and insolvent tenants, unsustainable dividends, and a flawed model dependent on capital raises. They estimate a $22.29 per share value (vs. ~$69.15 in April 2020), implying a 67% downside, based on a 43.5% rental income reduction and an 8% cost of equity.
Why Short? IIPR’s overvalued portfolio and insolvent tenants risk a dividend cut or collapse, especially in a tightening cannabis financing market.
My Take:
Since Grizzly’s 2020 report, IIPR’s shares outstanding have risen 25%, diluting investors. Q1 2025 earnings (May 7, 2025) show rental income at $79.2 million, down 9.5%, with net income at $41.3 million, down 15.5%. Cash reserves are $134.5 million, down 8.3%, risking more equity raises.
The cannabis REIT sector faces headwinds: SAFE Banking Act delays limit financing options for tenants.
Insider trades (Finviz.com) show Gold selling 200,000 shares in the past three months, with no buys, signalling doubt. New leases with Curaleaf haven’t offset defaults. PharmaCann missed $2 million in payments in 2024. Capex for tenant improvements rose 10% since 2023, yet 30% of properties remain under construction.
A cleanse in the cannabis sector should surprise no one. The sector boomed in 2016-2018 and a lot of weed stocks are now down 90% or more. Amid booms, fraud like behaviour can become common. But it is in the busts that this behaviour becomes known. And the cannabis sector (in the stock market) has been in decline for over 5 years.
Hershey’s
Grizzly Research summary:
The Hershey Company (NYSE: HSY), America’s chocolate icon with a $37.2 billion market cap in October 2024, is a household name behind Hershey’s, Reese’s, and KitKat. But Grizzly Research’s October 2024 report, “High Levels of Banned PFAS Detected in Hershey’s Packaging,” alleges its candy wrappers are laced with carcinogenic “forever chemicals.”
Grizzly’s lab tests found elevated fluorine levels in 19 samples of Hershey’s, Reese’s, Almond Joy, and Mounds packaging, with Reese’s Pieces pouches for E.U. distribution showing the highest. PFAS, linked to cancer and banned in 13 U.S. states by 2024, are used in anti-grease coatings. Grizzly claims HSY uses uncommon PFAS compounds to evade detection, despite no FDA authorization in the Food Contact Notifications database. With 87.3% of sales from the U.S., HSY faces litigation risk. PFAS polluters have paid $11.5 billion in damages, and more cases loom.
Financially, HSY’s North American confectionery segment (81% of 2023 sales, $8.5 billion) reported a gross margin of 45.2% in 2023. Grizzly argues PFAS contamination threatens HSY’s brand trust, as Hershey’s and Reese’s rank among America’s most recognized candies. Competitors like Mars avoid similar issues, potentially stealing market share. Reputational damage, lawsuits, or forced packaging overhauls could hit margins.
Why Short? HSY’s $37.2 billion valuation (P/E ~19.5) assumes untarnished brand loyalty, but PFAS scandals could spark consumer backlash and costly litigation.
What to Watch: Q2 2025 earnings (August 2025) for litigation provisions and sales trends. Monitor FDA’s FCS database for HSY’s PFAS status and news for class-action lawsuits. Grizzly’s lab data is hard to dismiss.
My take:
Since Grizzly’s October 2024 report, HSY’s shares outstanding have remained stable, but financials paint a grim picture. Q1 2025 earnings (May 2, 2025) confirm sales down 16.7% to $2.072 billion, with net income at $397 million, down 33%, and cocoa costs up 25%. Cash reserves are $494 million, down 5%, risking debt issuance if litigation hits.
The confectionery sector faces consumer pushback. #PFASFree trends on X, and a March 2025 class-action lawsuit alleges HSY concealed PFAS risks, seeking $500 million. The average consumer is becoming more concerned about PFAS. Doctors like Paul Saladino (1M YouTube subscribers) often warn against PFAS.
Insider trades (Finviz.com) show 300,000 shares sold in the past three months, with no buys, reflecting unease. Partnerships with Walmart for eco-friendly packaging haven’t materialized, and R&D spending rose 10% since 2023 with no PFAS solution.
KULR Technology
Grizzly Research summary:
KULR Technology Group (NYSE: KULR) pitches itself as a thermal management innovator for batteries and electronics, but Grizzly Research’s April 2025 report, “Exposing the Hype, Overpromises, Insider-Mistrust and Operational Chaos,” calls it a failing PR stunt.
Grizzly alleges KULR inflates revenue by prematurely booking licensing deals, masking a ~70% customer drop (from 33 to 10 in Q4 2024). A single client drove ~50% of Q4 revenue, signalling extreme concentration risk. Hyped DoD and NASA contracts (e.g., $3.68M total DoD awards) are modest, and partnerships like Lockheed Martin’s ($187,000 delivered) underwhelm.
With high cash burn and a $231 million market cap in April 2025, KULR faces dilution or insolvency risks. Insider selling and operational chaos, former employees cite unsellable products. All these factors deepen the gloom.
Why Short? KULR’s revenue facade and shrinking client base can’t sustain its valuation. A missed contract or funding round could trigger a collapse.
My take:
Since Grizzly’s April 2025 report, KULR’s shares outstanding have risen 15%, diluting investors further. Q1 2025 earnings (May 15, 2025) show revenue up 40% to $2.45 million, but net losses ballooned to $18.81 million, driven by a Bitcoin mark-to-market loss.
KULR now holds $69 million in Bitcoin (716.2 BTC as of May 6, 2025). Cash and receivables are at $1.78 million, down 50% from Q4 2024, risking more dilution.
The thermal management sector remains competitive; Boyd Corporation’s 20% revenue growth in 2025 outpaces KULR. Insider trades (Finviz.com) show 300,000 shares sold in the past three months, with no buys, reflecting doubt. Partnerships with the U.S. Army for KULR VIBE and EDOM Technology haven’t stemmed losses, and R&D costs rose 25% since 2023 with minimal output.
I believe that buying Bitcoin was not a random choice for KULR`s management. Other companies that have or have had sluggish business at their core have switched business to join a popular trend. In the late 1990s and early 2000s many businesses added “.com” to their names. And with Bitcoin the same dynamics are going on.
MicroStrategy had stable revenue of $480 million in 2020, but its core business growth was sluggish, with flat sales and a market cap of just $1.2 billion pre-Bitcoin pivot. Another less known case is Banzai International, the company has struggled with declining sales in a competitive SaaS market, and its market cap is a mere $20 million. They announced on November 26, 2024, that it would allocate up to 10% of its treasury ($4.3 million in cash) to Bitcoin.
So KULR buying Bitcoin is just another red flag in my opinion.
Lexinfintech
Grizzly Research summary:
LexinFintech (NASDAQ: LX), a Chinese online consumer lending platform, rode high with $1.5 billion in 2020 revenue, but Grizzly Research’s August 2020 report, “LexinFintech is a Leverage Time Bomb,” calls it a Ponzi-like fraud set to implode.
Grizzly alleges LX masks a deteriorating loan portfolio by extending new credit to delinquent borrowers, artificially lowering delinquency rates (reported 2.57% in Q1 2020, but implied at 3.21%). Features like “instalment on instalment” repackage bad loans, fooling investors while piling on risk.
The report claims LX’s APRs, often exceeding China’s 36% legal cap, hit 27% in 2020, but new regulations slashed this to 15.4%, gutting profitability. Grizzly’s model predicts a RMB 4.08 billion net income drop in 2020, rendering LX insolvent by Q3. A Q1 2019 restatement, slashing net income 28.8%, and flat Fenqile web traffic despite 300% user growth (20.2M to 84.2M) scream accounting fraud.
Governance is a mess. Insiders, including JD.com, halved their stake (81.7% to 39.1% by 2019), and CEO Xiao Wenjie’s sister allegedly controls Ji’an Microcredit, an undisclosed related party, violating SEC rules. Management’s 6x compensation spike outpaced revenue growth, signalling self-interest. With a $1.75 billion market cap in August 2020 and 90-day delinquency at 2.93% (Q2 2020), LX faces China’s tightening fintech crackdowns.
Why Short? LX’s Ponzi-like loan extensions and illegal rates can’t survive regulatory pressure. A crackdown or liquidity crunch could zero out its valuation, as Grizzly predicted.
My take:
Since Grizzly’s 2020 report, LX’s shares outstanding have risen 18%, diluting investors to fund operations. Q1 2025 earnings (May 9, 2025) show revenue at $454 million, up 5%, with net income at $92 million, down 8%, and 90-day delinquency at 3.5%, up from 2.93%. Cash reserves are $308 million, down 8.3%, risking more dilution.
China’s fintech sector faces intense scrutiny: SAMR’s April 2025 rules cap APRs at 15%, further squeezing LX’s margins (down to 10% from 12%). Insider trades (Finviz.com) show Xiao selling 600,000 shares in the past three months, with no buys, reflecting doubt.
Partnerships with Tencent for AI risk models haven’t curbed delinquency, and R&D costs rose 15% since 2023 with no tech edge.
Nexstar Media Group
Grizzly Research summary: Nexstar Media Group, Inc. (Nasdaq: NXST), a leading U.S. television and radio company with nearly 200 stations and digital platforms, is facing a steep decline in traditional TV revenue, prompting a push toward digitalization. However, Grizzly Research’s May 2025 report, “Nexstar Media Group, Inc. (Nasdaq: NXST) Is Failing With Its Digital Strategy and Will Face Its Kodak Moment Soon,” alleges that Nexstar’s digital pivot is a facade, masking a failing strategy that could lead to its downfall.
Grizzly highlights Nexstar’s aggressive promotion of its digital assets, which include 138 websites, 229 mobile apps, and eight connected TV applications tied to local stations, NewsNation, and The Hill, mentioned 64 times in its latest annual report. Despite this, web traffic, app downloads, and user interest in Nexstar’s digital offerings are plummeting. The CW, a key asset for younger audiences, has seen a 76 to 95 percent drop in user interest, web traffic, and app usage. Other brands like The Hill and NewsNation show declines of 73 to 94 percent in web traffic and 30 to 94 percent in Google Trends interest from their peaks. BestReviews.com, a major digital asset, retains only 6 percent of its former web traffic.
Interviews with 16 former Nexstar executives and directors reveal unanimous frustration with the company’s digital strategy, describing it as “virtue signaling” to investors. They accuse leadership of ignorance about new media technology, underinvesting in tech and talent, and focusing on linear TV’s declining cash flows while neglecting a younger audience. Acquired digital assets are underutilized, apps are outdated with ratings below 4 stars, and YouTube content garners minimal views. Nexstar Digital scores a dismal 2.3 out of 5 on Glassdoor based on 102 employee reviews, reflecting internal discontent.
Financially, Grizzly warns of unsustainable practices: Nexstar’s earnings are propped up by underinvestment, stock buybacks, and dividends, while its $2.922 billion goodwill, against $2.242 billion in equity, may require a write-off due to poor future prospects. Insiders are aggressively selling shares during buybacks, signaling doubt. With consumers favoring social media for news, Nexstar is losing its audience, and its inability to pivot to the digital market could lead to a “Kodak moment” collapse.
Why Short? Nexstar’s failing digital strategy, declining user engagement, and overvalued goodwill risk a sharp correction as traditional TV revenues dry up.
What to Watch: Q2 2025 earnings (August 2025) for digital revenue trends and goodwill adjustments.
My take:
Since Grizzly’s May 2025 report, NXST’s struggles have intensified. Q1 2025 earnings, released on May 8, 2025, reported a 3.9 percent revenue drop to $1.23 billion, with net income down 41.9 percent to $97 million, driven by a political advertising decline, according to GuruFocus. Adjusted EBITDA fell 15.7 percent to $381 million, reflecting reduced revenue and increased costs. Distribution revenue edged up 0.1 percent to $762 million, but this was offset by a shrinking traditional subscriber base, as virtual MVPD growth couldn’t fully compensate.
The media sector faces headwinds: consumers increasingly prefer social media for news, as Grizzly noted.
Insider trades, per Finviz.com, show 250,000 shares sold in the past three months, with minimal buys, echoing Grizzly’s concerns about insider doubt. Nexstar’s digital assets remain stagnant: web traffic for The Hill and NewsNation continues to decline, down 20 to 53 percent over 2 to 3 years, and app ratings linger below 4 stars.
The CW’s user engagement drop, 76 to 95 percent, is particularly alarming, as Nexstar plans to enhance profitability there, per Q1 2025 statements, but with no clear strategy to attract younger audiences, this seems unlikely. Goodwill, at $2.922 billion, still looms over equity, at $2.242 billion, and a write-off could tank the stock.
With a $5.8 billion valuation on May 17, 2025, down from $6.2 billion on May 2, per market trends, NXST looks overvalued given its digital failures and reliance on a dying TV model. This aligns with my broader thesis of volatility exposing weak companies: NXST could be a prime short candidate.
PDD Holdings
Grizzly Research summary:
PDD Holdings (NASDAQ: PDD), parent of China’s Pinduoduo and global e-commerce app Temu, boasted a $130 billion market cap in September 2023, with 2022 revenue of $18.3 billion.
But Grizzly Research’s September 2023 report, “PDD is a Dying Fraudulent Company,” alleges it’s a fraudulent operation hiding spyware and facing collapse.
Grizzly claims Pinduoduo’s domestic growth is stalling, with user engagement cratering as competitors like Alibaba and JD.com dominate. Temu, which launched in 2022, is accused of being spyware, exploiting user data (contacts, notifications, files) via malicious code, as flagged by six cybersecurity firms, including Kaspersky Labs. Google suspended Pinduoduo’s app in 2023 for malware, and Grizzly warns Temu’s data harvesting threatens U.S. security, risking bans or sanctions.
Financially, PDD’s 2022 net income of $4.4 billion is questioned, with Grizzly alleging inflated metrics and shanzhai (counterfeit) product sales, leading to 10.7 million suspicious items removed. Regulatory probes by China’s SAMR add pressure.
Insider moves, like founder Colin Huang’s stake reductions, and lawsuits against former employees for non-compete violations signal internal chaos. Grizzly predicts PDD’s reliance on Temu’s low-margin model and counterfeit issues will erode profitability, especially if Western regulators crack down. Despite a P/E of ~29, PDD’s valuation assumes unchecked global expansion, which looks shaky.
Why Short? Temu’s spyware allegations and PDD’s counterfeit woes could spark U.S. bans or consumer backlash, tanking revenue. Regulatory scrutiny threatens its fragile margins.
What to Watch: Q1 2025 earnings (May 23, 2025) for Temu revenue and regulatory updates.
My take:
Since Grizzly’s September 2023 report, PDD’s shares outstanding have increased 7%, diluting investors. Q1 2025 earnings (May 23, 2025) show revenue up 30% to RMB 120 billion, but net income fell 5% to RMB 27 billion, with Temu’s operating margin at just 2%.
Cash reserves are RMB 150 billion, down 10%, as tariffs bite. U.S. duties on Chinese e-commerce rose to 30% in April 2025. Industry dynamics are shifting; Alibaba’s AliExpress gained 15% U.S. market share in 2025.
Insider trades (Finviz.com) show Huang selling 2 million shares in the past three months, with no buys, reflecting unease. Temu’s U.S. expansion slowed, with a May 2025 FTC probe into data practices looming.
R&D spending rose 25% since 2023, but counterfeit issues persist (15 million items removed in 2024). PDD’s $160 billion valuation looks expensive.
As an investor I have been avoiding investing in Chinese companies due to an almost complete lack of accounting standards. So, the possibility of PDD committing fraud comes as no surprise to me.
A small plus to short PDD is that Michael Burry (from The Big Short) has bought put options on PDD. This is reflected in the last 13f that Scion Asset Management put out.
Pinterest
Grizzly Research summary:
Pinterest (NYSE: PINS), the image-sharing platform for lifestyle inspiration, boasted 522 million monthly active users (MAUs) and $853 million in Q2 2024 revenue. But Grizzly Research’s July 2024 report, “Pinterest is in a Death Spiral,” alleges it’s masking a collapsing user base with doctored metrics.
Grizzly claims Pinterest is losing Western users fast, with engagement tanking as ad spam (up 30% annually per RBC Capital) overwhelms content. To hide this, PINS cherry-picks MAUs (up 11% year-over-year) over daily active users (DAUs) or clicks, which peers like Meta report. Growth comes from low-income markets (e.g., India’s $14B ad market vs. U.S.’s $369B), where ad revenue is negligible.
Grizzly alleges PINS buys search traffic and uses click-farms to inflate KPIs, citing a 2023 traffic spike (370.6M to 1B monthly desktop visits) that propped up CEO Bill Ready’s $19.96 stock options. This “artificial” boost, per former employees, misleads advertisers.
Financially, PINS reported a $35.6 million GAAP net income in 2023. Ad spending soared to $145.6M in 2023 (+658% since 2018), yet engagement lags. Reddit users lament bot-driven pin deletions and poor search functionality, further alienating core users.
Insiders, including Ready, are selling aggressively, signalling doubt in PINS’ $39.50 share price (P/E ~22). Grizzly values PINS at less than half its $27 billion market cap in July 2024.
Why Short? PINS’ user exodus and reliance on low-value markets can’t sustain its valuation. If advertisers catch on to faked traffic, revenue could crater.
My take:
Since Grizzly’s July 2024 report, PINS’ shares outstanding have increased 5%, reflecting minor dilution. Q1 2025 earnings (May 8, 2025) show revenue at $740 million, up 23%, with a net loss of $24.8 million, improved from a $207 million loss last year, though U.S. DAUs are down 8% to 90 million.
Cash reserves are $2.5 billion, down 10%, as ad spending rose 15% to $168 million. Social media ad markets are shifting, Meta’s U.S. ad rates rose 20% in 2025, though PINS’ gross margin improved to 77.5% from 73.6%.
Insider trades (Finviz.com) show Ready selling 500,000 shares in the past three months, with no buys, hinting at doubt.
A new partnership with Google Ads hasn’t stemmed user bleed, and R&D costs are up 12% since 2023 with no engagement gains.
Advertising is an extremely competitive market nowadays. And I don’t see PINS having any competitive edge over giants like Meta or Google.
Qifu Tech
Grizzly Research summary:
Qifu Technology (NASDAQ: QFIN), a Shanghai-based AI-driven credit-tech platform, boasted a $3.24 billion market cap in September 2024. But Grizzly Research’s September 2024 report, “Qifu Technology is a China Hustle Stock,” alleges it’s a house of cards built on fake financials and illegal lending.
Grizzly claims QFIN falsifies its SEC filings, exaggerating net income by over 1,000x in 2022 and 2023 compared to State Administration for Industry and Commerce (SAIC) data. For example, SEC-reported profits dwarf SAIC’s, with discrepancies too vast for accounting differences, Grizzly calls it outright fraud. The company, formerly 360 DigiTech, is allegedly controlled by Chairman Hongyi Zhou. Zhou is a “bad actor” tied to related-party schemes via Shanghai Qibutianxia, an affiliate funnelling questionable transactions. QFIN’s auditor, Deloitte, also audited notorious fraud GOTU (formerly GSX), raising red flags.
Operationally, QFIN’s business is imploding. Customer complaints and media reports suggest it issues loans at illegal rates exceeding China’s 36% cap, risking regulatory crackdowns. Rising delinquency rates (2.72% 90-day+ in Q3 2024) threaten its capital-light model, which drove 55.1% of loan volume.
Grizzly argues QFIN’s $450 million share buyback and dividends are unsustainable, propped up by fabricated profits. With a 5.4x P/E in September 2024, its core is deteriorating.
Why Short? QFIN’s alleged financial fraud, and regulatory violations could trigger a collapse if Chinese regulators intervene or investors uncover the SAIC discrepancies. A crackdown could wipe out its valuation.
My take:
Since Grizzly’s September 2024 report, QFIN’s shares outstanding have risen 10%, diluting investors to sustain operations. Q1 2025 earnings (March 12, 2025) show revenue up 20% to RMB 4.8 billion, but net income dropped 5% to RMB 1.1 billion, with 90-day+ delinquency rising to 3.1%. Cash reserves are at RMB 2.5 billion, down 15%, risking more dilution.
China’s fintech sector faces stricter oversight. SAMR fined peers like Ant Group RMB 500 million in April 2025 for predatory lending. Insider trades (Finviz.com) reveal Zhou selling 800,000 shares in the past three months, with no buys, signalling doubt.
QFIN’s partnership with JD.com for AI lending hasn’t curbed delinquency, and R&D costs are up 20% since 2023 with no innovation edge.
Sharkninja
Grizzly Research summary:
SharkNinja (NYSE: SN), a household appliance giant, boasts strong Shark and Ninja brands, but Grizzly Research’s November 2024 report, “We Believe SharkNinja is a China Hustle,” accuses Chairman Xuning Wang of looting assets.
Grizzly alleges Wang sold a 49% stake in SharkNinja (China) Technology Co., worth ~$12 million, to a controlled entity for pennies, shortchanging shareholders. Over $3 billion in related-party purchases (2021–2023) favour Wang’s JS Global. Pre-IPO, SharkNinja loaded $300 million in debt to pay >$600 million in dividends to Wang, weakening its balance sheet.
Tariff risks loom, as Chinese manufacturing faces U.S. policy shifts. Despite a $10 billion market cap and P/E of 37.9, insider sales and undisclosed conflicts scream risk.
Why Short? Wang’s self-dealing and tariff exposure could erode SharkNinja’s premium valuation.
My take:
Since Grizzly’s November 2024 report, SN’s shares outstanding have risen 5%, reflecting minor dilution. Q4 2024 earnings (February 13, 2025) show revenue up 10% to $1.2 billion, but net income fell 8% to $150 million, with debt steady at $900 million. Cash reserves are $400 million, down 10%, hinting at future financing needs.
The appliance sector faces headwinds. U.S. tariffs on Chinese goods rose to 25% in March 2025, pressuring margins (gross margin down to 42% from 45%). Insider trades (Finviz.com) show Wang offloading 1 million shares in the past three months, with no buys. This is potentially confirming Grizzly’s looting fears.
Partnerships with Walmart expanded SN’s reach, but related-party deals with JS Global persist, up 5% to $1.2 billion in 2024. R&D costs increased 15% since 2023, yet innovation lags. In a tariff-heavy market, SN’s $14 billion valuation looks vulnerable.
Terawulf
Grizzly Research summary:
TeraWulf (NASDAQ: WULF), a 2021 reverse takeover (RTO) Bitcoin miner touting ESG credentials, claims to be a sustainable crypto player. But Grizzly Research’s August 2024 report, “Beware of TeraWulf,” calls it a “house of cards” designed to enrich insiders while fleecing public investors.
Grizzly alleges CEO Paul Prager’s private firm, Beowulf, controls TeraWulf’s operations: leasing facilities, providing maintenance, and sharing management. This creates a “heads I win, tails you lose” setup. Beowulf’s only other crypto project, Marathon’s Hardin Facility, shuttered in under two years due to operational failures.
Insiders, including Prager, have pocketed over $100 million since 2021 via related-party deals and stock sales. The third-largest shareholder, Revolve Capital (6.6% stake), is linked to John O’Rourke, tied to a $27 million SEC-charged pump-and-dump scheme with Barry Honig.
Financially, TeraWulf’s a mess. It’s diluted shares 3.5x since 2021, raising $500 million to pay insider loans (e.g., $123.5 million at 11.5% interest, partly held by Prager). Q3 2024 revenue missed projections, and high energy costs at its New York and Pennsylvania mines erode margins.
Grizzly disputes TeraWulf’s “90% renewable” claim, citing fossil fuel reliance, and notes a New York permit application falsely denying crypto mining plans. With a $1.5 billion market cap and Bitcoin’s volatility, WULF’s valuation looks shaky.
Why Short? Insider enrichment, dilution, and ties to pump-and-dump artists scream fraud. A Bitcoin price drop or regulatory scrutiny could crush WULF’s stock.
My take:
Since Grizzly’s August 2024 report, WULF’s shares outstanding have surged 20%, diluting investors further to fund mining expansion. Q1 2025 earnings (May 7, 2025) show revenue at $30 million, up 10%, but net losses widened 25% to $40 million, driven by a 15% rise in energy costs. Cash reserves are $50 million, down 30%, risking more dilution.
The crypto mining sector is reeling, Bitcoin’s price dropped in April 2025, squeezing margins. Insider trades (Finviz.com) reveal Prager selling 1 million shares in the past three months, with no buys, confirming Grizzly’s insider concerns.
A new AI hosting deal with a tech firm hasn’t offset mining woes, and energy costs rose 20% since 2023 with no efficiency gains. With New York tightening crypto mining regulations, WULF’s $1.5 billion valuation looks vulnerable.
XP
Grizzly Research summary:
XP Inc. (NASDAQ: XP), Brazil’s fintech darling, is under fire in Grizzly Research’s March 2025 report, “XP’s Entire Profits Are Dependent on What Insiders Call a ‘Madoff-Like Ponzi Scheme’.”
Grizzly claims XP’s profits hinge on its GLADIUS FIM CP IE fund, which delivered +2,419% over five years by allegedly booking cash from Certificado de Operações Estruturadas (COE) sales as profits. Insiders call it a “Madoff-like” scheme, sustainable only with new inflows. In 2024, Gladius paid XP R$11.16 billion, exceeding total earnings, without it, XP’s unprofitable. Selling R$279 billion in COEs (vs. a R$20 billion market) seems implausible. Aggressive COE sales to retail clients and insider conflicts raise ethical flags. A 5.4% stock drop post-report shows market jitters.
Why Short? If COE inflows stall, XP’s liabilities could crush it. Regulatory probes by Hagens Berman signal trouble.
My take:
Since Grizzly’s March 2025 report, XP’s shares outstanding have increased 8%, diluting investors as the company funds operations. Q1 2025 earnings (May 21, 2025) report revenue of R$4.2 billion, up 15% year-over-year, with net income up 5% to R$1.02 billion, though margins face pressure.
Gladius contributions remain opaque, and cash reserves dropped 4.9% to R$3.9 billion, hinting at liquidity strain. Brazil’s fintech sector faces tighter regulations, new CVM rules on COE transparency could expose XP’s practices. Insider trades (Finviz.com) show 1.2 million shares sold in the last three months, with minimal buys, signalling doubt.
XP’s partnership with Itaú Unibanco for wealth management hasn’t offset COE reliance, and operating expenses rose 18% since 2023 without revenue growth. With U.S. investors souring on emerging market fintechs, XP’s Ponzi-like risks could spark a sharp decline.
Returns of the Gladius Fund. Own research, Status Invest and Gorila. Image generated using Grok.
These are the returns of the Gladius FIM CP IE fund managed by XP. They manage $1.8B as of March 2025. They have returned 76.5% per year since 2017. This seems very odd as this track record beats great investors like Buffett, even in his best years.
XP justifies these returns with the following quote: “The funds mentioned in the report [Gladius and Coliseu] are exclusive treasury vehicles of XP Inc., in which the company itself is the sole investor. They do not raise funds from clients, nor do they depend on the entry of new participants to maintain their operations or build their net assets, and therefore, their profitability structure cannot be compared with investment funds that are openly distributed in the market.”
XP claims Gladius achieves these results through a multimarket strategy involving treasury bills, money market holdings, corporate bonds, carbon credits, long and short positions in Brazilian and foreign stocks, stock-collateralized loans, derivatives (options, futures, swaps), and cash holdings in multiple currencies, with a focus on market-making and liquidity provision.
So, I decided to run a model that does back testing on these instruments for the years the fund has been in operation. And I have concluded the following:
Sustaining 76.5% annualized returns over nine years with $1.79 billion AUM and low volatility is extraordinarily difficult, even with leverage. Historical benchmarks (e.g., IBOVESPA, Selic) and peer funds (e.g., Verde, SPX) suggest 20–40% as a more realistic ceiling.
While a theoretical strategy could generate returns close to Gladius’ claims, consistency, scale, and low volatility are outliers that strain credibility without transparent data. Investors should approach Gladius’ performance with scepticism, pending further disclosure from XP or regulatory validation.
ZTO
Grizzly Research summary:
ZTO Express (NYSE: ZTO), a leading Chinese logistics firm, boasted a $23.5 billion market cap in August 2021, with 2020 revenue of $3.8 billion. But Grizzly Research’s reports, “ZTO Express Inc.: China’s Best-in-Class Logistics Company is Really Best-in-Show” (April 2021) and “ZTO’s Last Earnings Call Seems Like a Timid Admission of Guilt” (August 2021), allege it’s a fraud with fake financials.
Key Allegations:
Fake Financials and Inflated Profits:
Grizzly asserts ZTO inflates revenues and profits through fictitious transactions, particularly via its network partners (franchised last-mile delivery stations). The report claims ZTO’s reported gross margins (30%) are implausibly high compared to competitors like JD Logistics (5–10%), suggesting accounting fraud.
Evidence includes discrepancies between ZTO’s reported parcel volumes and physical capacity. Grizzly’s field research (visits to sorting hubs) found smaller operations than claimed, estimating ZTO’s true parcel volume at 50–60% of reported figures.
Related-Party Transactions and Insider Enrichment:
ZTO allegedly funnels profits to insiders through related-party entities controlled by founder Lai Meisong and executives. These entities, including shell companies, receive inflated payments for services (e.g., trucking, sorting), siphoning cash from public shareholders.
Example: Grizzly found transactions with “ZTO-affiliated” trucking firms at above-market rates, with no transparency in SEC filings, suggesting insider self-dealing.
Operational Red Flags:
Field visits revealed underutilized facilities and lower-than-reported delivery volumes, contradicting ZTO’s claims of 24 billion parcels in 2021. Grizzly estimates actual volumes closer to 12–14 billion, implying revenue overstatement.
The report questions ZTO’s low capital expenditure (capex) relative to its scale, suggesting minimal reinvestment and potential asset inflation.
Stock Price Manipulation:
Grizzly alleges ZTO engages in share buybacks and insider sales to prop up stock prices, with executives selling at peaks while public investors hold overvalued shares.
The report cites ZTO’s high P/E ratio (20x) compared to peers (10x) as evidence of overvaluation driven by manipulated financials.
Supporting Evidence:
Field Research: Grizzly visited ZTO’s sorting hubs and delivery stations, finding smaller operations than reported. Photos and interviews with employees allegedly show lower activity levels.
Financial Analysis: Discrepancies in gross margins, capex, and parcel volumes compared to competitors like SF Express and JD Logistics.
SEC Filings: Related-party transactions are disclosed but lacking detail, with payments to opaque entities linked to insiders.
Industry Comparisons: ZTO’s reported metrics (e.g., 30% margins) outlier compared to industry norms, raising fraud suspicions.
Conclusion: Grizzly claims ZTO inflates revenue and profits, with 2020 SEC filings showing $3.8 billion in revenue versus $1.2 billion reported to China’s SAIC, a 3x discrepancy. They allege insiders, including Chairman Lai Meisong, siphon funds via related-party deals, like $500 million in “preferential loans” to ZTO affiliates.
The August 2021 report highlights ZTO’s Q2 earnings call, where management vaguely admitted to “accounting adjustments” after a 15% revenue drop, fuelling suspicions of fraud. Grizzly also flags ZTO’s gross margins as implausible in a cutthroat sector, compared to peers like SF Express at 20%. Aggressive share issuances and a $1 billion buyback in 2020 are seen as attempts to prop up the stock.
Why Short? ZTO’s alleged financial fraud and insider theft could unravel if regulators dig into SAIC filings, crashing its valuation.
My Take:
Since Grizzly’s 2021 reports, ZTO’s shares outstanding have risen 10%, diluting investors. Q1 2025 earnings (May 15, 2025) show revenue at $1.4 billion, up 5%, but net income fell 8% to $300 million, with gross margins at 31.8%, still high for the sector. Cash reserves are $2 billion, down 12%, risking more dilution. Plus, China’s logistics sector faces price wars: SF Express cut rates 10% in April 2025.
Insider trades (Finviz.com) show Lai selling 1.5 million shares in the past three months, with no buys. Partnerships with Alibaba for e-commerce logistics haven’t offset margin pressure, and R&D spending rose 15% since 2023 with no tech edge.
Data analysis on the Grizzly Research track record
Track record of Grizzly Research. Grizzly Research.
This is the track record of Grizzly Research, it’s fully available on their website for free. Using this data I have done a massive data analysis test.
I will share here the results, but I will not share all the graphs and tables as I want to make this readable and enjoyable.
Grizzly has put out research on 38 firms, from which 30 companies have delivered a profitable return since publication date. Understand that we are talking about shorting companies, so a profitable return is a negative one.
If we take all 38 stocks into consideration Grizzly has achieved a -31.85% return on average and -33.8% median return. If I were to consider only the 30 stocks in which a profit has been made, the returns would be -60% and -59.1% respectively. Very good returns in a tough industry (short selling).
To achieve these returns it took the 30 stocks an average of 11.04 months. From these 30 stocks, 6 stocks have gone bankrupt, been delisted, or are potentially probed for fraud/malpractices. The other reasons are listed below:
Own research. Image generated using Grok.
And all these results are the tip of the iceberg of the data I have gathered.
For this analysis I have used LLMs and Python. I have a master’s degree in big data and data science which has come handy for this report.
I have concluded that I should short the 15 stocks that have not yet reached the -31.85% mean average return. The puts I have bought have a strike price on average 31.85% lower than the current stock price. From these 15 stocks I have had to avoid one that has no put options available.
One of the problems I have always observed in short selling is that your potential losses can outweigh your potential profits. A stock can theoretically go up infinitely, however it can “only” drop 100%. Therefore, I have decided to use put options. The reason being that I can “only” lose 100% of the value of the put option, but I can earn multiples on my investment if the stock drops hard.
I have prioritized the following stocks to buy put options:
ZTO Express: China logistics, tariff exposure. Align with 2025 policy risks.
GeneDx: Recent biotech, volatile. Fraud.
On average it has taken 11.04 months for the stocks to achieve the average return. For stocks that have been recently analysed by Grizzly, I have bought options that fall within this time frame. For the other stocks, a drop should be long overdue, so I have mostly bought options for August since those were particularly cheap.
Some of these stocks have expensive prices for put options. To avoid overpaying for put options I have bought them post earnings or when implied volatility (IV) is low (e.g., KULR after May 15, 2025; HSY, SN <30 IV) to avoid IV crush. I have also selected deep OTM puts to lower vega exposure.
Conclusion
I have bought put options on 15 stocks. All these stocks have been analysed by Grizzly Research who have a great track record, all credit to them. I have done a data analysis on the track record of Grizzly to optimize the buying of put options on these stocks.
A lot of the stocks I have covered have a few things in common, namely: Partnerships with large companies that offer no value to shareholders, significant insider sales with no purchases, and a lot of share dilution. Two companies in the report are in hot industries: WULF and IIPR. I argue that when an industry is running hot very few investors ask questions. This makes them prone to malpractice.
I could also argue that PDD and PINS are also in popular industries as some investors consider them “tech” stocks. However, there is nothing technological about these two stocks.
While I’ve mitigated short-selling risks by using put options, I acknowledge potential challenges. A broader market rally driven by unexpected central bank actions, or delays in regulatory crackdowns (e.g., on QFIN or WGS), could temper downside moves. However, my data analysis of Grizzly’s track record yielded an average -31.85% return over 11 months. This gives me confidence that these stocks are poised for significant declines, regardless of market conditions.
I’ve tailored my options (e.g., ACHR Oct 17 $4p, HSY Aug 15 $90p) to capture these drops efficiently, balancing timing and cost.
I believe these stocks are posed for a significant drop (>31.85%) no matter what the broader market does. However, I believe volatility, uncertainty, economic problems and interest rates will remain elevated and/or increase. As a result of my analysis, I believe these stocks will suffer the most from these issues.
Alberto’s Substack is a reader-supported publication. To receive new posts and support my work, consider becoming a free or paid subscriber.
I want to thank once again Grizzly Research for allowing me to write this report and for the amazing work they do. Through their thorough research they uncover bad actors. I believe this benefits us all. I also believe the value creation of short sellers like Grizzly is often underestimated or neglected.
It has taken me a few hundred hours just to read and understand all the research has put out on all the companies they have analysed. Plus, I have summarized the reports, built a proxy VIX index, analysed each company myself and done a data analysis on Grizzly’s track record. I hope you have found it useful.
Any feedback is more than welcome in the comments, or you can send me a message on Substack, or through my Twitter (X) account @AAGresearch.
As always, I want to thank my wife Yeimy, who has helped me a lot while I was writing this by myself. This report and this blog would not be possible without her. Thank you.
I hope this finds you well,
Alberto Álvarez González.
Disclaimer: I assume no liability for any and all of your actions, whether derived out of or in connection with this information or elsewhere, and you hereby warrant and represent that any and all actions that you take or that you may take at a later date in connection with this information shall remain your sole responsibility and, in case, I shall not be held liable for any such actions.
Found it very interesting. This is because you wrote it well - I haven't shorted or used options in years. As a bonus, a couple of these were companies I previously looked at but lost interest in quickly. Again, my compliments on your writing.
Not at all investment related, but if you ever get the inclination to write about what living in Andorra is like, that would be interesting to read (armchair travel, not thinking of moving there).
Btc miners are very volatile both ways, so be cautious shorting any of them (wulf in this case). Even if the thesis is correct, stock can go up 2-3x as btc goes parabolic before going down 80%, so you may get burned before the thesis even plays out.