


Platinum Group Metals: A Comprehensive Supply and Demand Forecast to 2050
PGM Crisis Looms: 90% Grade Drop Since 1800, Deficits to 2050

Summary
· In this report I have analysed every platinum group metal (PGM) mine, project, and company worldwide. Particularly, I have analysed their production and production capacity long term.
· I have also gathered data on the average global PGM grade, and the depth of mines going back to the 1800s. In addition to this, I have created a supply and demand model that should predict PGMs for the next 25 years. Building a S&D model was the aim of this report.
· There is plenty of production and production capacity today and for the long term. However, there is no incentive to produce PGMs at these prices, particularly due to the low quality of current mines.
· This situation resembles the one I found in 2017, but with a different commodity: Uranium. There was (and is) plenty of production capacity from uranium miners, but there was no incentive to produce it.
· The strategy that worked best for uranium was the one I followed: Buying the highest quality developers. That is what I am doing with PGMs. I own shares in Generation Mining (TSE: GENM) and Bravo Mining (CVE: BRVO).
· For those of you overseeing a portfolio too big to invest in Generation or in Bravo: Johnson Matthey PLC (LON: JMAT) has leverage to PGM prices as they recycle these metals, while offering a sustainable dividend. Another option is the Sprott Physical Platinum and Palladium Trust (NYSEARCA: SPPP) for physical metals.
Glossary of terms

Glossary of terms.
Projects in developments
I have been working on this project ever since I posted my report “Palladium and platinum: The dawn of a new bull market” on March of 2024.
To build a proper demand and supply demand I need to be able to predict both, with certain assumptions. Demand was the more complicated part as you will see later. The supply side has meant a lot of hard work, but a fun project. For the latter I have first gathered all the data on every single PGM project, mine, and company worldwide.
Mining first starts with exploration and development. Therefore, if I can identify every possible PGM project going online in the next decades, I can predict new supply. For existing supply, I have identified and analysed every mining, refining, and recycling operation for PGMs worldwide.
So, let us start with development and exploration projects:

Company reports. Own research. PGM projects in development.
In this table you can find all PGM projects in development. I have also included exploration stage projects if they have a resource. I have excluded from the table the following items: ownership %, co-owners, location, reserves, resources, attributable reserves/resources, projected production, projected production year, AISC, price assumptions and LOM. I have excluded them to make the table easier to read for you.
However, I have included all these factors into my supply and demand model.
One of the most challenging factors to determine in this report was the projected start year. This is because some projects are at various stages and affected by different regulations.
The logic I followed for the timelines for the projected start year is grounded in historical construction timelines for PGM mines, tailored to each project’s current development stage as of May 2025. Historically, PGM mines take 3–5 years for construction (averaging 4 years) once permits are secured, as seen in examples like Platreef (2022–2025, 3 years) and Mogalakwena (5 years in the 1990s), with permitting often adding 1–2 years (e.g., Marathon: 2023–2025).
For projects with specific start years like Waterberg (2029), Platreef (2027+), and Bengwenyama (2027-2028), I retained the timelines from feasibility studies, as they align with historical averages (permits + 3–4 years construction). For Marathon, now shovel-ready with permits secured on May 22, 2025, I adjusted the start to 2028-2029, reflecting a 3–4 year construction timeline post-permitting.
For those of you as interested in mining as I am, or more, these timelines will seem overly optimistic to you. I have preferred to be optimistic on this factor, so I will obtain a very conservative supply and demand model. I am fully aware that mines can take 20 plus years to get permitted, financed and built.
Historical average global grade for PGM mines

Average PGM grade of mines since the year 1800. Own research.
To get this graph I have had to read through geology and history books on PGMs. Throughout history these have been the main regions where PGMs have been extracted:
Primary regions:
· Colombia (Chocó): Early 1800s, placer mining, ~100 kg/year, grades ~30 g/t.
· Russia (Urals): 1823 onward, placer mining, peaking at 5 tonnes/year, grades declining from 25 g/t to 10 g/t.
· South Africa (Bushveld): Early 1900s and onwards. Massive deposits at increasing depths. Lower grade.
Minor regions:
· United States (California, Oregon): 1850s onward, placer byproduct, negligible output, grades ~20 g/t.
· Australia (New South Wales): 1890s, placer, negligible output.
· South Africa (Transvaal): 1890s, placer, experimental, negligible output.
Trend: Platinum mining in the 1800s was dominated by placer deposits, which were high-grade but quickly depleted. Colombia started the century, but Russia took over by the 1820s, supplying most of the world’s platinum until the early 20th century. In the 20th and 21st century South Africa and Zimbabwe have provided the vast majority of PGMs. However, Russia now plays a key role too.
Since 1800 the average grade has dropped 90%. Since 1950 it has dropped 44%. Since 1980 it has dropped 28% and since 2000 it has dropped 13%. Average grade worldwide is now at 2.85 g/t PGM.
The grade represents the combined physical grade of all PGMs (Pt + Pd + Rh + Ru + Ir + Os) in the ore, weighted by the production volumes of each region or mine.
This drop in grade may not sound important to generalist investors, but it is of critical importance for the economics of a project. For instance, lower grade means that more fuel has to be used to transport ore, as it now contains less PGMs. Lower grades also mean that more solvents and acids have to be used. All these factors affect economics, and make current operating projects undesirable.
Data for PGM producers
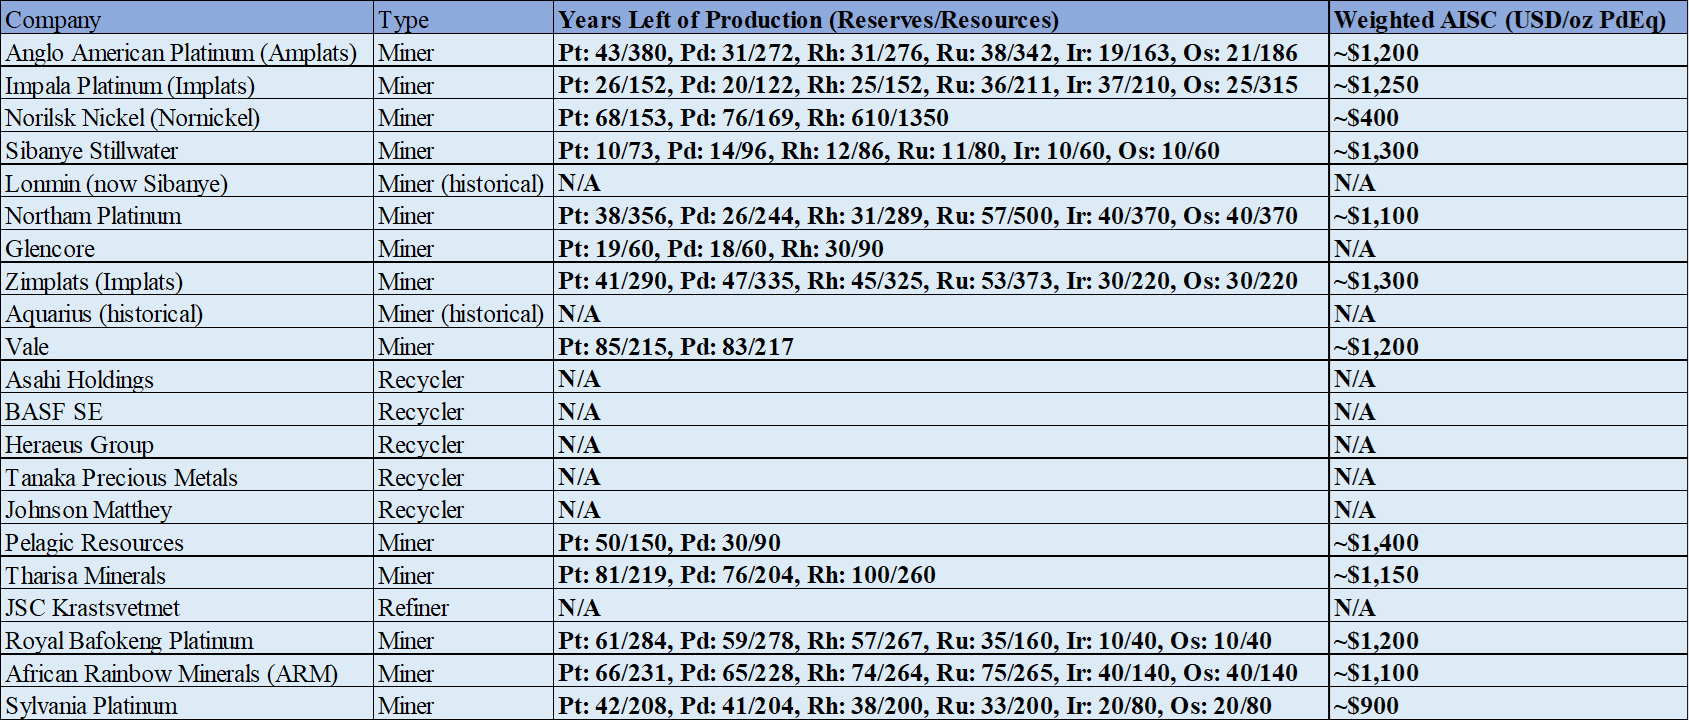
Data for PGM companies. Company reports.
In this table you can find all PGM companies worldwide. These include refiners, recyclers, and miners. Although Recyclers do not have an AISC, they are mostly profitable. I have excluded from the table the following items: Reserves, resources, price assumptions and 2024 production. I have excluded them to make the table easier to read. However, they are all included in the supply and demand model.
As you can see, most miners are not profitable at metal prices nowadays. Currently both platinum and palladium are hovering the $1000/oz price mark. So right now, only Nornickel and Sylvania have profitable PGM business segments. Sylvania is irrelevant in the market as it is a small producer. But Nornickel produces much of the world´s palladium.
However, as I have posted on other PGM reports in this blog, I think Nornickel is becoming more market orientated than ever before. They are aware that they are flooding the market with cheap palladium, and this is causing other miners to lose money. If this were to continue, Nornickel would not have a market to sell into in a few years.
Plus, other Russian miners are having trouble getting supplies for certain materials. Mining is a very technical business, meaning that they require extremely specific machinery. With the sanctions from the US and the EU, Russian companies have to get supplies from Indian and Chinese companies. However, many of the parts and machines that Nornickel needs are only produced in markets with high added value products, like those in the EU or the US.
Therefore, I believe it is a matter of time before Nornickel encounters supply issues.
Another key factor in this table is the item “Years left of production.” This column represents how many years of production each company has left based on their reserves or resources and their 2024 production.
As you can observe, PGM miners have decades left of production in their reserves, in their resources some of them have centuries left till they run out of ore. Therefore, there is no shortage of resources.
However, with grades going down and the depth of mines increasing, I believe that a lot of the resources and reserves will not be economical soon. This will push miners into taking over higher grade and shallow deposits like those owned by Generation Mining or Bravo Mining.

Average depth of PGM mines worldwide. Own research.
Up until the 20th century Colombia and/or Russia dominated the PGM industry. In the very early 1900s Russia had to start digging deeper for PGM mining and Canada started PGM mining. At that time, PGM mining went from mining at surface or near surface to mines that were 80+ metres deep. This happened in the span of less than 10 years.
In the 1920s South Africa started mining for PGMs and this only exacerbated the problem. Mines were anywhere from 50m to 300m deep. In the later part of the 20th century Zimbabwe started PGM mining and that meant deeper mines too.
Today the average depth of a PGM mine is around 1800m (5,900ft)
For context, in deep mines like those in South Africa, unventilated areas at 1,800 meters might feel 50–60°C (122–140°F) or hotter due to humidity and equipment heat. With cooling, workers might experience 25–35°C (77–95°F). This means that miners spend capital in building complex cooling systems. All this makes mining more expensive.
Building my supply and demand model
For my model I have considered the following PGM producing mines and operations:

PGM producing assets worldwide. Company reports.
I may have missed a mine or two in the process, so if you notice any missing, please let me know.
So far, I have gathered all PGM projects in development or exploration and all the companies producing PGMs at any point of the cycle. One could think this is enough, but it is not. This is because primary PGM mines produce around 67% of the world´s PGMs. So, I had to dig deeper and find out where the other ounces come from.
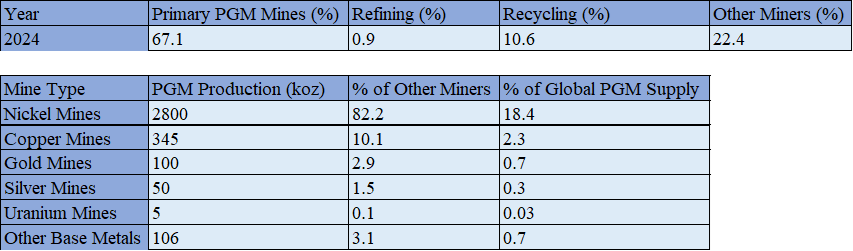
Sources of PGMs. Norilsk Nickel, Vale Sudbury and reports from other companies. Own research.
It turns out that recycling makes up 10% of the world's PGMs, mainly from auto parts and electronics. And 22% comes from other mines.
From the 22% of PGMs other mines produce, the vast majority comes from nickel mines that produce PGMs as a byproduct. An example of this would be Russian nickel mines producing palladium.
Now that I have accounted for every ounce available in the market, lets dive into the actual supply and demand model:
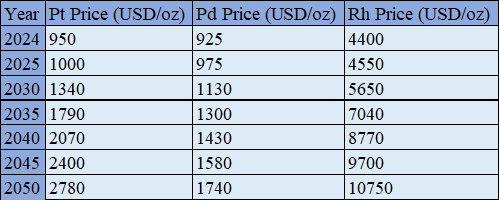
Price assumptions. Own research.
The price assumptions for Pt, Pd, and Rh through 2050 are driven by the supply-demand dynamics following a slower EV adoption rate (20% penetration by 2030, 60% by 2050), which causes the decline in Pd and Rh automotive demand while increasing Pt substitution in catalytic converters, exacerbating Pt deficits and tightening Rh’s balance.
Platinum prices rise from $1,000/oz in 2025 to $2,780/oz by 2050, with a 6% annual increase through 2035, reflecting growing deficits (-1,864 Koz in 2025 to -4,273 Koz in 2050) fuelled by hydrogen demand and substitution, surpassing the $1,425/oz incentive threshold by 2028 to spur new supply.
Palladium prices increase from $975/oz to $1,740/oz, with a 3% annual growth through 2035, as smaller surpluses (+1,349 Koz by 2050, down from +3,972 Koz) due to sustained ICE/hybrid demand and industrial growth push prices above the $1,200/oz incentive by 2035.
Rhodium prices grow from $4,550/oz to $10,750/oz, with a 4% annual increase through 2040, balancing a tighter market (+595 Koz by 2050) with industrial demand and substitution risks, exceeding the $5,500/oz incentive by 2030, ensuring supply stability. These forecasts, more responsive to market nuances than WPIC’s flat outlook, align with the need to incentivize new production amid evolving demand trends.

Supply and demand model for palladium, platinum, and rhodium. Own research
My model predicts a deficit until at least 2050. The only outlier may be 2030-2032 as I predict that some of the mines currently in development may come online. However, I may be too optimistic on that front as mining projects can take anywhere from 3 to 20 years to get permitted and built.
The key takeaway here is that the PGM market will experience deficits for longer than the WPIC anticipates. This will push miners into increasing production, but most of their mines are too deep, low grade or in a difficult jurisdiction. Therefore, they will buy out the best developers they can find.
Assumptions in the Supply and Demand Models
This section is about assumptions for the model I built. If it does not interest you, jump onto the next section.
The supply and demand model for PGMs (Pt, Pd, Rh) was built with several assumptions to project supply and demand from 2024 to 2050. I will break these down by component, critically examining their basis and potential impact on accuracy.
Supply Model Assumptions
1. Primary Supply (Mining)
Baseline Production (2024):
Assumption: Total PGM mine production in 2024 is 13,626 Koz, based on Statista’s 2022 figure of 14,047 Koz, adjusted for a 3% decline in 2024.
Basis: Statista provides a reliable global estimate, and WPIC’s Pt figure aligns with industry consensus. The 3% decline reflects operational challenges (e.g., South Africa’s 2% decline or Russia’s 9% drop).
Impact: If the decline is underestimated (e.g., due to unforeseen disruptions), supply could be lower, increasing deficits.
Grade Decline:
Assumption: Global average PGM grade declines logarithmically from 2.87 g/t in 2024 to 2.60 g/t by 2050 (2.75 g/t by 2030, 2.65 g/t by 2040). This translates to a 0.8% annual production decline through 2035, slowing to 0.4% post-2035.
Basis: Historical grade decline data (30 g/t in 1800 to 2.87 g/t in 2024) shows a long-term trend of depletion. The logarithmic decline assumes technological improvements (e.g., better extraction) slow the rate of decline over time.
Impact: If technology advances faster (e.g., AI-driven mining), the decline could slow further, increasing supply. Conversely, faster depletion (e.g., deeper UG2 mining) could reduce supply.
Decline Rates for Existing Mines:
Assumption: South Africa declines at 0.8% annually through 2035, then 0.5%; Russia at 2% through 2030, then 1%; other regions (Canada, Zimbabwe, USA) at 0.5% through 2030, then 0.3%. Weighted decline: 1.04% through 2030, 0.6% post-2030.
Basis: WPIC notes a 1% decline in South Africa for 2024, adjusted to 0.8% with tech improvements. Russia’s 2% reflects geopolitical risks, easing post-2030. Others’ slower decline assumes stability.
Impact: Overestimating declines (e.g., if South Africa stabilizes) could underestimate supply, while underestimating risks (e.g., Russian sanctions) could overestimate supply.
2. Secondary Supply (Recycling)
Baseline (2024):
Assumption: Recycling supply is 1,611 Koz (Pt: 620 Koz, Pd: 680 Koz, Rh: 150 Koz).
Basis: WPIC data aligns with industry trends.
Impact: If recycling is underestimated (e.g., new tech boosts recovery), supply could increase, reducing deficits.
Growth Rate:
Assumption: Recycling grows at 5% annually through 2035, then 3% through 2050, reaching 21% of total supply by 2050.
Basis: Sibanye’s Reldan acquisition suggest faster growth than the previous 3%.
Impact: Faster growth (e.g., policy support) could increase supply, while delays (e.g., legislative hurdles) could constrain it.
3. Future Supply (Exploration & Development)
Project Start Dates and Production:
Assumption: Projects start as per the Table (e.g., Darwendale 2026, Waterberg 2029, Luanga 2035), with production estimates based on table data (e.g., Waterberg: Pt 190 Koz, Pd 150 Koz, Rh 30 Koz).
Basis: Start dates are from the table, with delays factored in for post-2035 projects (20% probability, e.g., geopolitical risks in Zimbabwe).
Impact: Delays or cancellations (e.g., funding issues) could reduce supply, while early starts could increase it.
Demand Model Assumptions
1. Baseline (2024):
Assumption: Pt: 7,730 Koz (Automotive: 3,130, Jewellery: 1,900, Industrial: 2,400, Investment: 300); Pd: 8,000 Koz (Automotive: 6,800, Industrial: 800, Jewellery: 100, Investment: 300); Rh: 1,000 Koz (Automotive: 900, Industrial: 100).
Basis: WPIC 2024 data.
Impact: If demand is underestimated (e.g., stronger hydrogen growth), deficits could widen.
2. Demand Growth Rates:
Automotive:
Pt: Stable in 2025, then 5% growth through 2035 (hydrogen fuel cells), 3% post-2035.
Basis: I project 143 tonnes (4,600 Koz) by 2050 for hydrogen, implying rapid growth.
Impact: Faster hydrogen adoption could increase deficits.
Pd: 6% decline in 2025, 3% annually through 2035 (EV adoption, 30% penetration by 2030), 1% post-2035.
Basis: EV trends reduce Pd use in auto catalysts.
Impact: Slower EV adoption could increase Pd demand, reducing surpluses.
Rh: 1% decline through 2040 (substitution with Pt), then stable.
Basis: Substitution trends.
Impact: Faster substitution could reduce Rh demand further.
Jewellery:
Pt: 2% growth through 2040 (China demand), 1% post-2040.
Basis: WPIC notes 8% growth in 2024, moderated to 2% long-term.
Impact: Stronger Chinese demand could increase deficits.
Pd: Stable, minor segment.
Basis: Historical trends.
Industrial:
Pt: 5% growth through 2035 (hydrogen and glass fibre), 3% post-2035.
Basis: I project 50% hydrogen growth by 2050.
Impact: Underestimating hydrogen growth could widen deficits.
Pd: 3% growth through 2040 (chemicals and/or electronics), 2% post-2040.
Basis: Stable industrial use.
Rh: 3% growth through 2040 (chemicals), 2% post-2040.
Basis: Steady chemical demand as I have observed in chemical industry reports.
Investment:
Pt, Pd: 3% growth through 2035, 2% post-2035.
Basis: Precious metal investment trends.
Impact: Economic downturns could reduce investment demand, narrowing deficits.
General Assumptions
Market Stability: No major geopolitical or economic shocks (e.g., global recession, new sanctions on Russia) beyond those already factored in.
Impact: Unforeseen events could disrupt supply or demand significantly.
Substitution: Pt increasingly substitutes for Pd in auto catalysts, but no major breakthroughs in PGM-free catalysts by 2050.
Impact: Faster substitution could alter demand dynamics.
Massive conflict of interest
Excluding Norilsk Nickel, my estimates indicate that the PGM mining industry made $657M in 2024 in terms of net income. I have excluded the Russian miner because PGMs only make a portion of their net income. So, the company does not represent the reality of the industry.
The PGM industry has about $12.1B in liabilities, from which half is in the form of debt, which matures between 2028 and 2035. To face this debt, the industry has about $3.5B in cash.
However, if PGM prices remain the same, net income will continue to decrease for the industry. The only reason net income is positive is because gold is at all-time highs, and a lot of these miners produce gold.
Therefore, the industry is facing the same conflict of interest uranium was facing prior to 2020:
Shareholders want to make a return, which may imply closing mines to push PGM prices higher, and reducing management/workforce size or compensation to cut costs. Management does not want to close mines because they do not want to fire employees or face their stakeholders, and management does not want to lower their own salary. Employees do not want to get fired or have mines closed. And finally, bondholders want to get paid, therefore they do not want mining operations to be shut down.
Therefore, mining firms face a conundrum. They must stay alive, but that means sacrificing their own shareholders by keeping PGM operations going, even though they are burning money. This way they keep their salary, employees do not get fired and bondholders get paid.
Some PGM miners have already started reducing workforce and cutting production. But this has not been enough to push metal prices higher.
What is clear is that mining firms need to put their PGM operations on care and maintenance. But none of them have the courage to do so. Perhaps what they need is a good excuse. After all, Cameco shut down Cigar Lake Mine using the Covid pandemic as a reason. And that shut down was the spark that lit the fire for the birth of the uranium bull run in 2020-2021.
Conclusion
The PGM industry stands at a critical juncture, where geological constraints and market dynamics are set to reshape its future over the next 25 years.
Declining global grades—down 90% since 1800 to 2.85 g/t today—and ever-increasing mine depths, now averaging 1,800 meters, underscore the growing challenges of extracting these critical metals, driving up costs and environmental impacts as miners grapple with extreme conditions and complex cooling systems.
My supply-demand model forecasts persistent deficits for platinum, with shortfalls reaching 4,273 Koz by 2050, driven by surging hydrogen demand and substitution in auto catalysts, while palladium and rhodium markets shift toward smaller surpluses and tighter balances due to slower EV adoption.
Current prices—platinum at $1,000/oz, palladium at $975/oz, and rhodium at $4,550/oz—fail to incentivize new production, a situation reminiscent of the uranium market in 2017, where abundant capacity sat idle due to low prices. Norilsk Nickel’s low-cost production ($405/oz AISC) floods the market, undermining profitability for higher-cost miners like Sibanye Stillwater ($1,363/oz AISC), but looming supply chain disruptions from sanctions may force a market rebalance.
A critical barrier to recovery lies in the industry’s stakeholder conflicts: bondholders, with $12.1B in liabilities to protect, prioritize operational continuity; management (PGM miners) seeks to preserve jobs for employees; employees resist layoffs; and shareholders demand profitability, even if it means shuttering unviable mines. This four-way deadlock, reminiscent of uranium’s pre-bull run tensions, hinders decisive action, with the sector’s $3.5B cash reserves offering little buffer if prices remain low.
With decades of reserves left but diminishing economic viability due to depth and grade challenges, the best opportunities lie in high-grade, shallow developers like Generation Mining and Bravo Mining, which I have invested in to capitalize on the inevitable consolidation as majors seek viable assets.
Investors should brace for a prolonged PGM deficit, driving prices toward incentive levels—platinum to $2,780/oz, palladium to $1,740/oz, and rhodium to $10,750/oz by 2050—while keeping an eye on developers poised to meet future demand.
For those of you overseeing a portfolio too big to invest in Generation or in Bravo, Johnson Matthey PLC offers some leverage to PGM prices as they recycle these metals. I have analysed fully the company, and it stands to benefit from increased prices while offering a sustainable dividend. They have a great track record.
Another option is the Sprott Physical Platinum and Palladium Trust for physical metals. I like Sprott ETFs more than others as it is redeemable for metals.
However, I prefer developers as they offer more leverage to PGM prices.
Any feedback is more than welcome in the comments, or you can send me a message on Substack, or through my Twitter (X) account @AAGresearch.
As always, I want to thank my wife Yeimy, who has helped me a lot while I was writing this by myself. This report and this blog would not be possible without her. Thank you.
I hope this finds you well,
Alberto Álvarez González.
Disclaimer: I assume no liability for any and all of your actions, whether derived out of or in connection with this information or elsewhere, and you hereby warrant and represent that any and all actions that you take or that you may take at a later date in connection with this information shall remain your sole responsibility and, in case, I shall not be held liable for any such actions.
Excellent writeup! Since you project prolonged supply deficits for Platinum (as opposed to palladium) then a pure-play platinum ETF like PPLT may make more sense than the Sprott vehicle that holds both platinum and palladium.
Hi Alberto.
You have put a lot of work into this report and the level of detail is commendable. In the resources sector, it is extremely difficult to forecast demand / supply / price trends over such a long period of time and a lot of it is path dependent, whereby changes in any one variable can result in a non-linear change in other variables.
For me, as my investing career advances and the capital under management grows, my models become far more "back of the envelope". In this case
(a) An incorrect and widely held narrative that EV's will crush ICE / PHEV
(b) Supply < Demand deficit with inventories making up the imbalance
(c) Highly concentrated supply in only a few unstable jurisdictions
(d) China Inc. holds 80% of above ground inventory
(e) Current spot price is below c. 30% of producer's AIC
(f) High speculator short positioning in the commodity, possibly due to (a)
The combination of these factors means that at some point price discovery will occur. That inflection point will not be linear especially as / when Soros's Reflexivity kicks in.
Cheers
John